Arc Diagram
An arc diagram is a style of graph drawing, in which the vertices of a graph are placed along a line in the Euclidean plane, with edges being drawn as semicircles in one of the two halfplanes bounded by the line, or as smooth curves formed by sequences of semicircles. In some cases, line segments of the line itself are also allowed as edges, as long as they connect only vertices that are consecutive along the line.
The use of the phrase “arc diagram” for this kind of drawings follows the use of a similar type of diagram by Wattenberg (2002) to visualize the repetition patterns in strings, by using arcs to connect pairs of equal substrings. However, this style of graph drawing is much older than its name, dating back to the work of Saaty (1964) and Nicholson (1968), who used arc diagrams to study crossing numbers of graphs. An older but less frequently used name for arc diagrams is linear embeddings.
Heer, Bostock & Ogievetsky wrote that arc diagrams “may not convey the overall structure of the graph as effectively as a two-dimensional layout”, but that their layout makes it easy to display multivariate data associated with the vertices of the graph.
Sample Visualizations
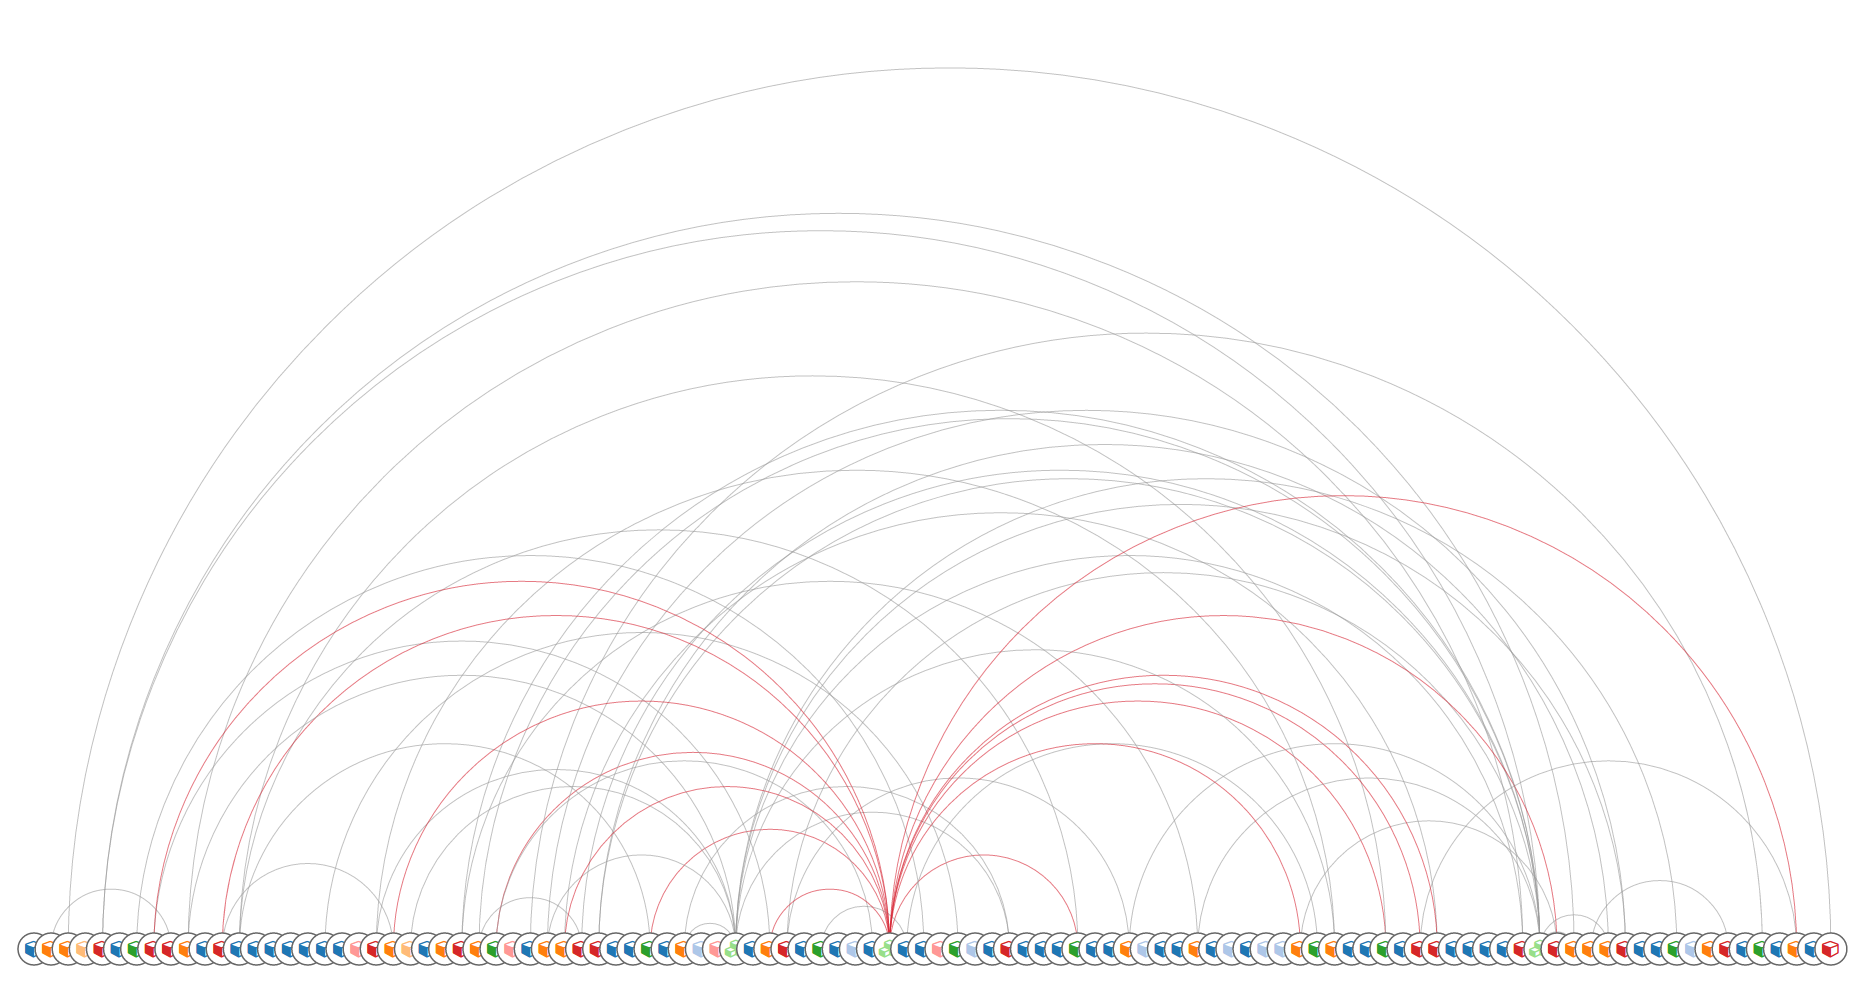
Arc diagram of OpenStack project’s resources (cca 100 nodes)